Beneath the Surface
Preserve the lake(s) you love.
If you are reading this, you probably love your lake want to preserve it for future generations of skiers, fishers and swimmers. (We do, too!) Through this annual Beneath the Surface report, we hope to equip you with the data and analysis that will give your family, organization or agency the insights needed to care for our lakes in the best possible ways.
On this page, we will recap the pages of Beneath the Surface that compare all 14 lakes we sample each summer: water clarity, dissolved oxygen content, phosphorus, nitrogen, and blue-green algae. Read analysis for your lake by downloading the 2020 report:

Water Clarity
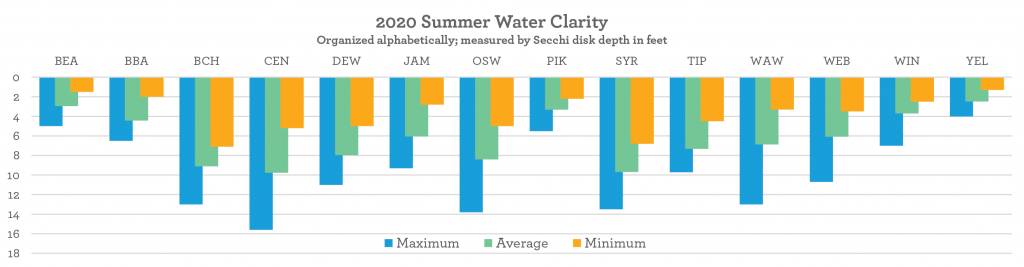
Secchi disk depth is a measure of water clarity, one of the first things you observe as you look down into a lake. Water clarity is reduced by the “stuff” suspended in the water – usually soil particles and algae. The size and content of the watershed, precipitation and water temperature all influence how much particulate and algae are present in the lake and how clear or murky the water appears as a result.
Nutrients can come from inflowing streams and the sediment at the bottom of a lake, stirred up by waves or boat props. These nutrients lead to increased algae growth, contributing to murky water.
The Secchi disk graph in Beneath the Surface (above) shows the maximum, average and minimum depths we could see into each lake across all eleven of our weekly measurements during the summer of 2020. The average of all summer 2020 Secchi disk readings was 6.3 ft, half of a foot deeper than 2019’s average of 5.8 ft. A higher overall average doesn’t mean the water clarity increased in each lake this summer, however. Take a look at the individual lake pages for a closer look at each lake’s 2020 Secchi disk measurements.
Dissolved Oxygen
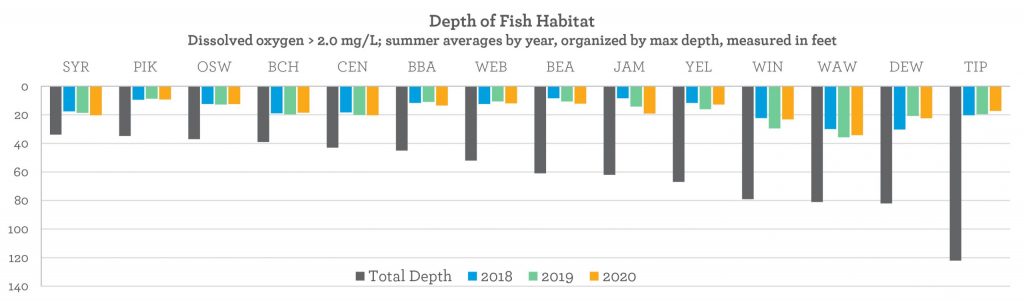
We are not the only ones interested in water quality! Fish rely on healthy lakes that have enough dissolved oxygen, which means their habitat can be limited by a lack of oxygen in the water. Dissolve oxygen is consumed by microbes, fish, and other organisms at the bottom of a lake, and as the lake warms in the summer, the oxygen near the bottom can run out.
Oxygen from the air cannot get all the way down to replenish the cool bottom layer of water. Only fish that can live in warm water near the surface get the oxygen they need. By reducing the amount of material decomposing at the bottom of a lake, we can hopefully slow that use of oxygen and make more room in the lake for fish to inhabit in the summer.
The lakes in this graph are organized from shallowest to deepest at their deepest point. Fish require a concentration of at least 2.0 mg/L of oxygen in the water to survive, so depth of habitat is where dissolved oxygen was measured greater than or equal to 2.0 mg/L oxygen. That oxygen concentration is a bare minimum, however; many species of fish need 3 or more times that amount to thrive and produce healthy offspring.
An interesting observation visible on this graph is that oxygen does not seem to vary from year to year in the same way among lakes. Many lakes’ fish habitat only varied by a foot or two of water from one year to the next, while others, like James, Winona, and Dewart, experienced greater shifts since 2018.
Total Phosphorus & Total Nitrogen
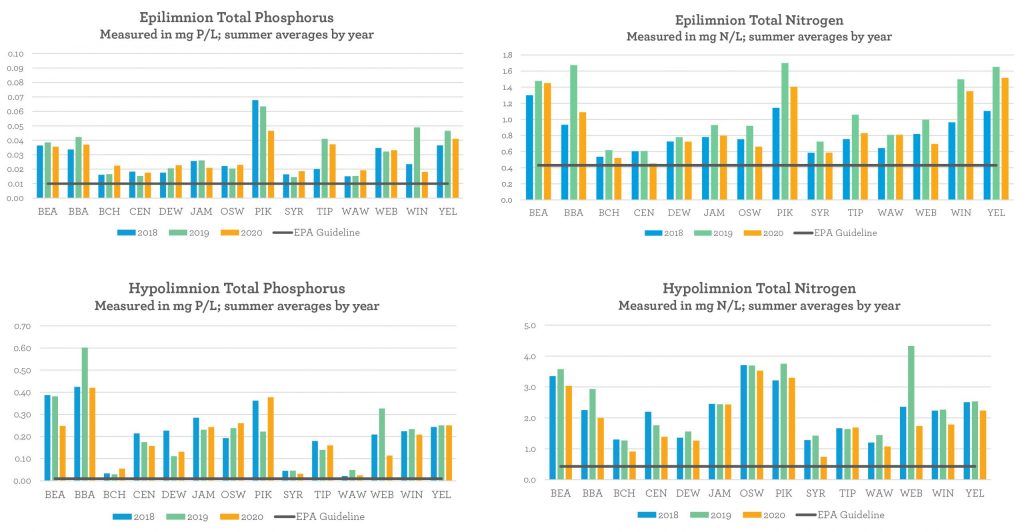
These four Beneath the Surface graphs show two nutrients – phosphorus and nitrogen – in two parts of the lake; the epilimnion is the top layer of water, and the hypolimnion is the bottom layer. (Epi- meaning “over,” and hypo-, “under”.) These layers do not mix in the summer, so we take a sample of both to gain a complete picture of each lake’s nutrient levels.
Phosphorus and nitrogen are two of our most important chemical parameters for lake health. They are both critical nutrients for supporting aquatic life, specifically rooted plants (weeds) and phytoplankton (algae). These two examples make up the foundation of the food chain.
But just as eating too much of the wrong food can negatively impact our health, too much of these nutrients can take a toll on our lakes and their inhabitants!
The gray bar on each of the nutrient graphs marks the EPA water quality guideline for a minimally impacted lake in our ecoregion. It is a low bar, which means it is a high goal! All of our lakes need help to reduce the amount of nutrients coming in. We want to increase water clarity and the depth of fish habitats.
Interpreting the Graphs
Note that the scales on these phosphorus and total nitrogen graphs are different. This highlights the fact that there are typically more nutrients in the hypolimnion than epilimnion in our lakes. Nutrients are coming from the bottom sediments of the lakes in addition to inflowing streams.
You can also observe that Big Chapman, Syracuse, and Wawasee lakes have relatively low total phosphorus concentrations in their hypolimnion layer. This indicates less nutrient loading from the sediments in these lakes.
The EPA guideline for total phosphorus is 0.010 mg P/L. The average total phosphorus across all 2020 epilimnion samples was 0.043 mg P/L, while the hypolimnion was 0.192 mg P/L. The EPA total nitrogen guideline is 0.43 mg N/L. The 2020 overall average total nitrogen was 0.921 mg N/L in the epilimnion and 1.935 mg N/L in the hypolimnion. 91% of 2020 samples were above the EPA guideline for total nitrogen, and 81% were above the total phosphorus guideline.
Blue-Green Algae (cyanobacteria)
Cyanobacteria (nicknamed “blue-green algae”) is a type of bacteria that survive through photosynthesis, like plants and green algae do. Cyanobacterial toxins, such as microcystin, can cause rashes, sickness and organ damage in humans. They can be especially fatal to dogs and other animals that come in contact with toxin-containing water. Our research focuses on the driving factors behind cyanobacteria blooms and toxin production in Kosciusko County. You can learn more about ongoing research projects on pages 26-27 of Beneath the Surface!
Microcystin in 2020
In 2020, there was a drop in microcystin concentrations in the 14 local lakes we sample. In fact, the average of all microcystin samples taken in 2020 was almost half of 2018 and 2019’s averages. That last bit is the most important! Although great news, this change is not yet a positive trend. The Lilly Center will continue researching to determine what led to this sudden dip, if it will stay that way in 2021 and beyond, and how we might permanently reduce toxin levels in the future.
- There were 33 and 39 fewer instances of detected microcystin in 2020 compared to ‘18 and ‘19, respectively.
- Eight lakes had no detections (nd) of microcystin in 2020. (Winona, Big Barbee, Center, Yellow Creek, Webster, Tippecanoe, Oswego, and James.) All 14 lakes had at least one detection in both 2018 and 2019.
Zebra Mussels
Zebra mussels are an aquatic invasive species. They filter-feed on green algae but do not consume cyanobacteria, throwing the phytoplankton community out of balance. In 2019, the Lilly Center surveyed the zebra mussel populations of the 14 major lakes using samplers set up on a number of residential piers.
- Zebra mussel spawning is triggered by warm water, a fact evidenced by high colonization numbers in July.
- The story of zebra mussels in our lakes is complex. The amount of summer spawning and colonization varies between our lakes and across them from area to area. Right now, zebra mussels seem to be a lot more prevalent in some lakes than others.
- Careful recreation is still super important! Two of our major lakes – and maybe more of our smaller ones – are still uninfested!